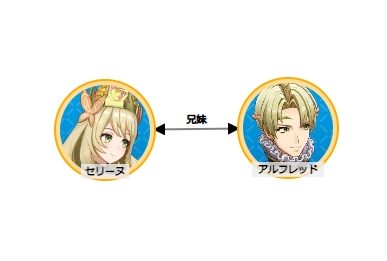
d3.js でドラッグで動かせるノードグラフを作りたかったので、とりあえずシンプルな2つのノードを線で繋ぎつつ、ドラッグで動かせるようにするサンプルを作ったので掲載しておきます。
ソースコードです。画像URL以外はコピペで動くと思います。
  <svg width="400" height="400"></svg>
  <script src="https://cdnjs.cloudflare.com/ajax/libs/d3/7.8.5/d3.min.js"
    integrity="sha512-M7nHCiNUOwFt6Us3r8alutZLm9qMt4s9951uo8jqO4UwJ1hziseL6O3ndFyigx6+LREfZqnhHxYjKRJ8ZQ69DQ=="
    crossorigin="anonymous" referrerpolicy="no-referrer"></script>
  <script>
    const width = document.querySelector("svg").clientWidth;
    const height = document.querySelector("svg").clientHeight;
    const nodeCount = 21;
    const nodesData = [];
    const imageWidth = 100;
    const imageHeight = 100;

    const fontSize = 13;
    class Node {
      constructor(
        index,
        label,
        x, y, radius, width, height, href,
        imageOffsetX, imageOffsetY,
        forceRateY = 1.0
      ) {
        this.index = index;
        this.label = label;
        this.x = x;
        this.y = y;
        this.radius = radius;
        this.width = width;
        this.height = height;
        this.href = href;
        this.imageOffsetX = imageOffsetX;
        this.imageOffsetY = imageOffsetY;
        this.forceRateY = forceRateY;
      }
    }

    nodesData.push(new Node(0,
      "アルフレッド",
      width * 0.5 - 50, height * 0.5,
      1,
      100, 100,
      "/blog/images/FehCylPortraits/CYL_Alfred_Engage.png",
      100, 100 / 2,
      0
    ));
    nodesData.push(new Node(1,
      "セリーヌ",
      width * 0.5 + 50, height * 0.5,
      1,
      100, 100,
      "/blog/images/FehCylPortraits/CYL_Celine_Engage.png",
      0, 100 / 2,
      0
    ));

    class NodeEdge {
      constructor(label, source, target, distance) {
        this.label = label;
        this.labelOffset = 6;
        this.source = source;
        this.target = target;
        this.distance = distance;
      }
    }

    const linksData = [];
    linksData.push(new NodeEdge(
      "兄妹",
      0, 1,
      300)
    );

    const svg = d3.select("svg");

    const link = svg.append("g")
      .selectAll("line")
      .data(linksData)
      .enter()
      .append("line")
      .attr("stroke-width", 2)
      .attr("stroke", "gray");

    const edgeLabels = svg.append("g")
      .selectAll("text")
      .data(linksData)
      .enter()
      .append("text")
      .attr("font-size", fontSize)
      .style("text-anchor", "middle")
      .attr("stroke", "black")
      .text(x => x.label);

    const colorScale = d3.scaleOrdinal(d3.schemeSet3);
    const node = svg.append("g")
      .selectAll("circle")
      .data(nodesData)
      .enter()
      .append("circle")
      .attr("r", function (d) { return d.radius })
      .attr("fill", function (d, i) {
        return colorScale(i);
      })
      .attr("stroke", "black")
      .call(d3.drag()
        .on("start", dragstarted)
        .on("drag", dragged)
        .on("end", dragended));

    const nodeLabels = svg.append("g")
      .selectAll("text")
      .data(nodesData)
      .enter()
      .append("text")
      .attr("font-size", fontSize)
      .style("text-anchor", "middle")
      .attr("stroke", "black")
      .text(x => x.label);

    const images = svg.append("g")
      .selectAll("image")
      .data(nodesData)
      .enter()
      .append("image")
      .attr("href", d => d.href)
      .attr("height", d => d.height)
      .attr("width", d => d.width)
      .call(d3.drag()
        .on("start", dragstarted)
        .on("drag", dragged)
        .on("end", dragended));


    svg.append("svg:defs")
      .selectAll("marker")
      .data(["arrow"])
      .enter()
      .append("svg:marker")
      .attr("id", String)
      .attr("viewBox", "0 -5 10 10")
      .attr("refX", 10)
      .attr("refY", 0)
      .attr("markerWidth", 6)
      .attr("markerHeight", 6)
      .attr("orient", "auto-start-reverse")
      .append("svg:path")
      .attr("d", "M0,-5L10,0L0,5");

    const simulation = d3.forceSimulation(nodesData)
      // .force('link', d3.forceLink().links(linksData))
      .on("tick", ticked);

    const fontHeight = 20;
    function ticked() {
      link
        .attr("x1", d => nodesData[d.source].x)
        .attr("y1", d => nodesData[d.source].y)
        .attr("x2", d => nodesData[d.target].x)
        .attr("y2", d => nodesData[d.target].y)
        .attr("marker-start", "url(#arrow)")
        .attr("marker-end", "url(#arrow)");

      edgeLabels
        .attr("x", d => (nodesData[d.source].x + nodesData[d.target].x) / 2)
        .attr("y", d => (nodesData[d.source].y + nodesData[d.target].y) / 2 - d.labelOffset);

      node
        .attr("cx", d => d.x)
        .attr("cy", d => d.y);

      images
        .attr("x", d => d.x - d.imageOffsetX)
        .attr("y", d => d.y - d.imageOffsetY);

      nodeLabels
        .attr("x", d => d.x - d.imageOffsetX + d.width / 2)
        .attr("y", d => d.y + d.height / 2 + fontHeight);

    }

    function dragstarted(e, d) {
      if (!e.active) simulation.alphaTarget(0.3).restart();
      d.fx = d.x;
      d.fy = d.y;
    }

    function dragged(e, d) {
      d.fx = e.x;
      d.fy = e.y;
    }

    function dragended(e, d) {
      if (!e.active) simulation.alphaTarget(0);
      d.fx = null;
      d.fy = null;
    }
  </script>